
How to Read Usage Reports
Who joined each meeting, when, for how long, and how.
The usage report lists every session in your rooms over a period you choose, with a row for each connection: who it was, when they came and went, what device they used, and what they did. It is the record to turn to for billing a client, checking attendance, or working out why someone had trouble connecting.
1. Run a Report
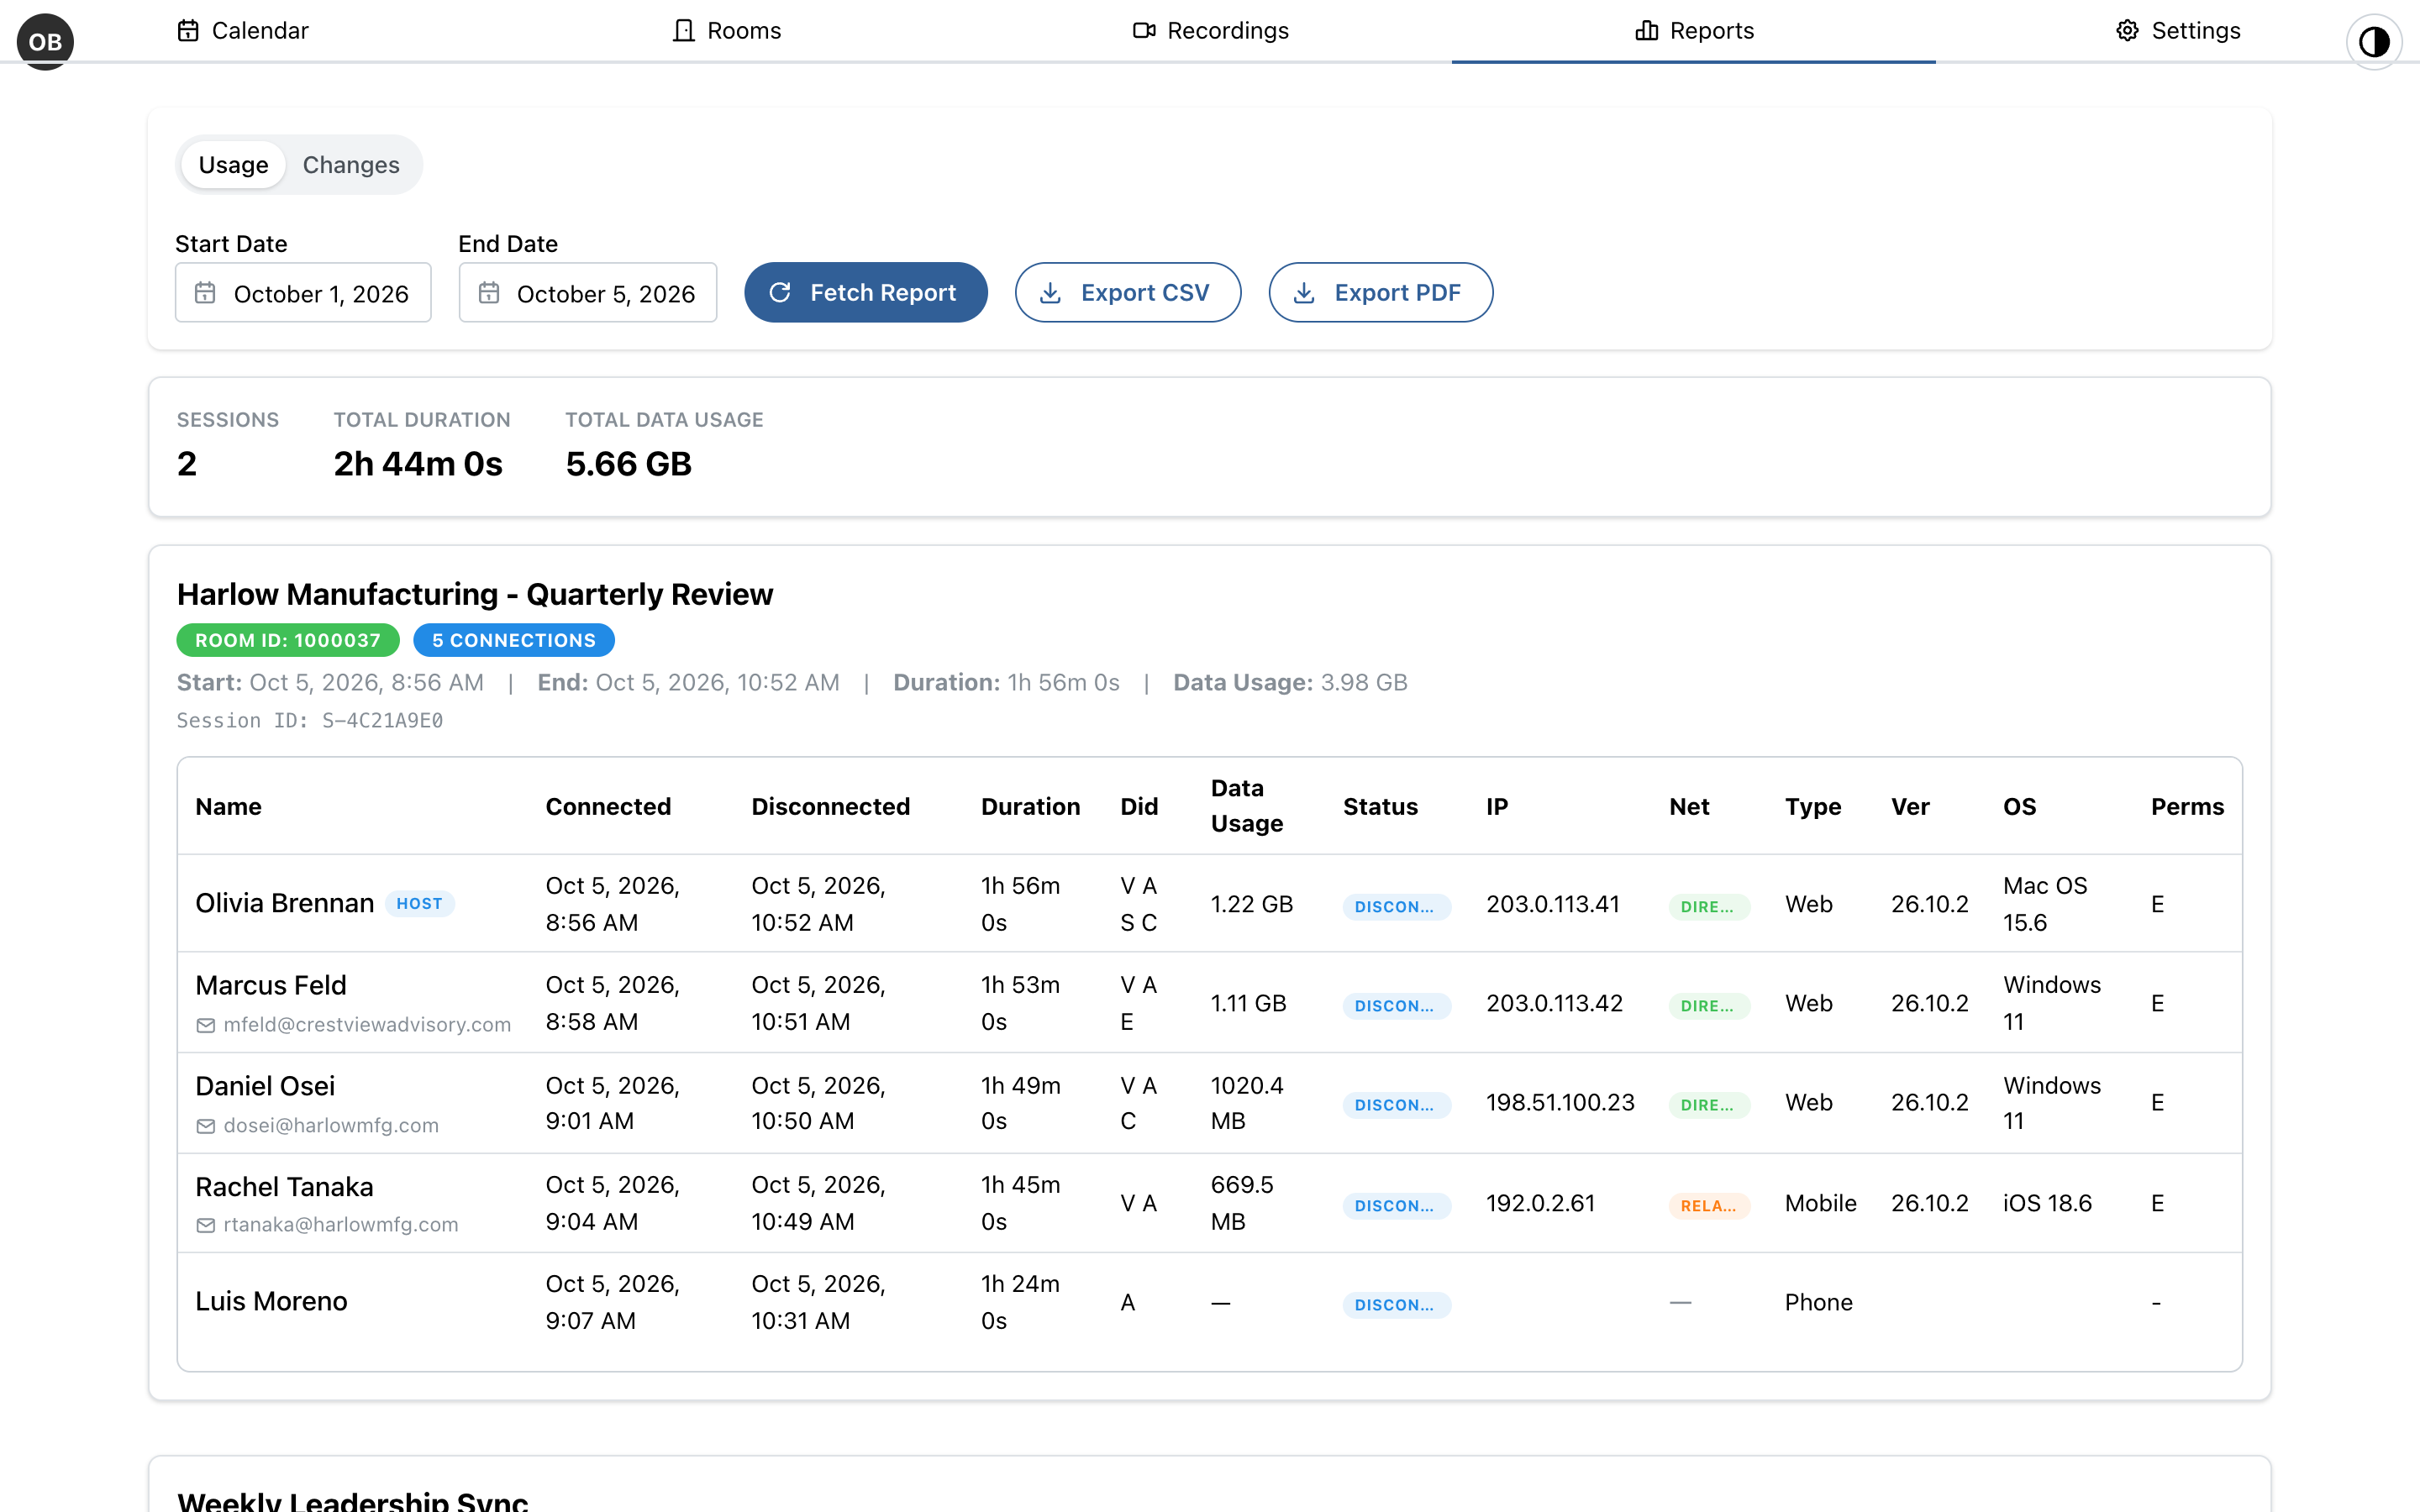
Click Reports in the top navigation. Leave it on Usage, choose a Start Date and an End Date, and click Fetch Report.
The report opens with totals for the period: the number of sessions, their total duration, and the total data used. Below that, each session has its own card with the room's name and number, how many connections it had, when it started and ended, how long it ran, and its data use.
2. Read Each Connection
Each row is one connection. Someone who dropped out and came back has a row for each time. The columns are:
- Name: as they joined, with HOST beside hosts, and their email address when they signed in or verified with one.
- Connected, Disconnected and Duration: when they joined and left, and for how long.
- Did: what they did in the session. V streamed video, A streamed audio, S shared their screen, E presented a file, and C sent chat.
- Data Usage: how much data their connection used.
- Status: for a session still running, Connected, or Waiting while they are in the waiting room; otherwise Disconnected.
- IP and Net: where they connected from, and whether their video went directly or had to be relayed (common on strict company and hotel networks).
- Type, Ver and OS: how they joined (Web, Mobile, or Phone for dial-in), the app version, and their operating system.
- Perms: E means they could upload and download files in the room.
3. Export the Report
Export CSV saves the report as a spreadsheet, with every column, for billing or your own records. Export PDF saves a copy to print or send.
4. See Changes to Your Rooms
Switch from Usage to Changes to see the edits made to your rooms' settings in the same period: what changed, who changed it, and when. Choose a Room to see only one. A change saved while a session was running in the room is marked, since it may have affected the people in it.
Explore MegaMeeting